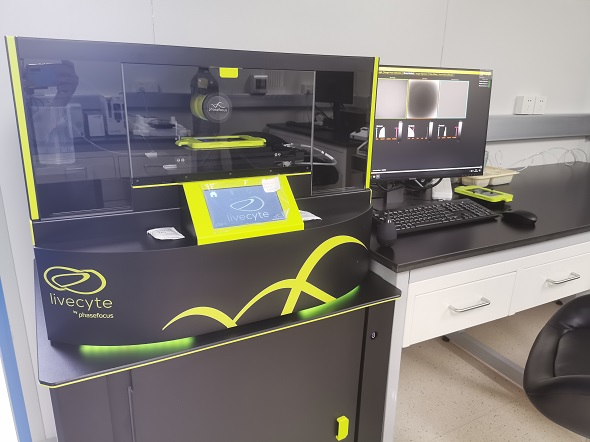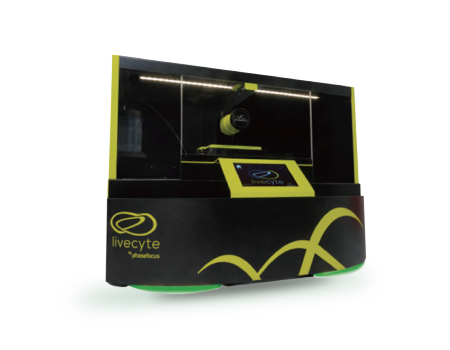
Livecyte Kinetic Cytometer
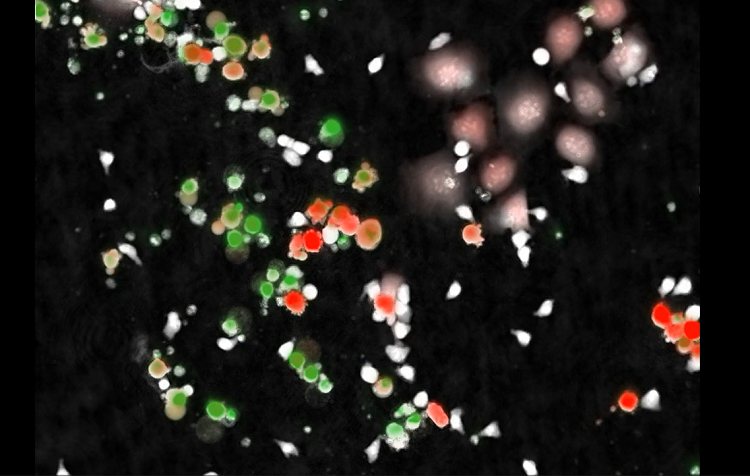
Livecyte produces exceptionally high contrast time-lapse videos using Ptychographic quantitative phase imaging (QPI) technology for a range of label-free assays with or without up to seven channels of complementary fluorescence.
Automated single-cell tracking of even the most sensitive cells quickly reveals subtle phenotypic differences in unperturbed cell populations.
Easy-to-use Dashboards present coherent and concise results from up to 96 wells at a time whilst retaining the ability to investigate individual cell behaviour and outlying characteristics.
Detail
Product Principles
Ptychographic Quantitative Phase Imaging
Livecyte™ utilises ptychography to capture relative phase shift information, allowing high contrast images to be generated using low level illumination. Individual cells can be identified and characterised according to morphological and behavioural characteristics, providing accurate data for quantitative analysis.

Ptychography works equally well in transmitted light and reflected light applications and, given suitable illumination sources and detectors, it can operate using any wavelength in the electromagnetic spectrum, as well electron and other particle waves and even sound waves.
Our flagship product, Livecyte, uses our powerful imaging techology to produce high-contrast videos of live cells without the need for fluorescent labels or high-power illumination. This makes it possible to monitor even the most sensitive live cells, such as stem cells and heterogeneous primary cancer cells, for long periods of time (up to multiple weeks) in a 96-well plate format.
Eliminate the constraints of photo-induced behaviour

Brief Introduction
Livecyte produces exceptionally high contrast time-lapse videos using Ptychographic quantitative phase imaging (QPI) technology for a range of label-free assays with or without up to seven channels of complementary fluorescence.
Automated single-cell tracking of even the most sensitive cells quickly reveals subtle phenotypic differences in unperturbed cell populations.
Easy-to-use Dashboards present coherent and concise results from up to 96 wells at a time whilst retaining the ability to investigate individual cell behaviour and outlying characteristics.


Product Characteristics
A label-free high-content system
Livecyte produces exceptionally high contrast time-lapse videos using Phasefocus’s patented Ptychographic quantitative phase imaging (QPI) technology for a range of label-free assays with or without up to seven channels of complementary fluorescence.
From Images to Insights
Easy-to-use image processing and tracking algorithms allow individual cells to be identified in real time.
Explore how the properties of those identified cells, and how they change over time.
Powerful Integrated Analysis
Integrated analysis suite enables cell behaviour to be monitored as a function of treatment.
Easily export results in Excel and Graphpad formats
Monitor many different types of behaviour, from morphological to motile, in every experiment making laboratory time more productive .
Assay-Level Analysis
Large fields of view (up to 4mm2) in an assay relevant plate format (up to 96 well plate) mean the behaviour of many cells can be captured making results statistically robust.
Unlike other QPI systems, Livecyte's ptychography technology removes the need for plate inserts or expensive consumables - reducing running costs compared to comparative systems.
Correlate changes in proliferation, motility and morphology as a function of treatment, from every experiment.
Explore Population Heterogeneity
Identify, track and classify individuals and monitor their phenotypic behaviour over time.
Classify subpopulations based of any combination of parameters.
Compare subpopulation behaviour as a function of treatment.
Single-cell Lineage
Automatically segment and track individuals and identify their division events and children.
Quick and easy track correction enables perfect lineage determination.
Explore single cell or whole lineage phenotypical properties across multiple generations.
A label-free high-content system

Single-cell Lineage:
Application Fields
Cell Proliferation and Growth
Cell Motility
Wound Healing
Macrophage Immunology
Cytotoxicity
Oncology
Stem Cell Imaging
Angiogenesis
Application
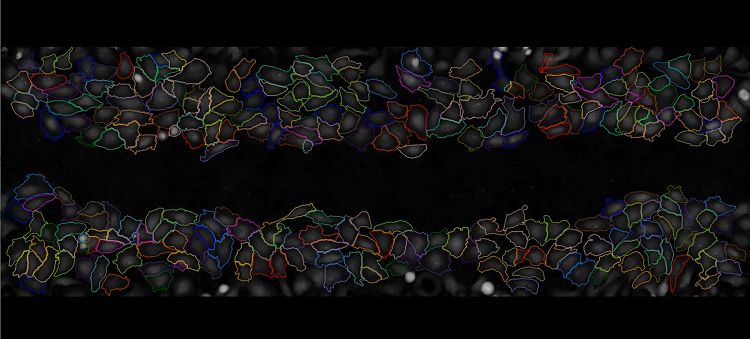
1、Characterisation of sub-populations of heterogeneous cell cultures
Individual cell segmentation of the TA and CB subpopulation within a heterogenous culture. The suite of metrics extractedusing the Livecyte’s Cell Analysis Toolbox (CAT) software illustrate distinct phenotypic differences between the subpopulations.
CB cells clearly have a larger cell area, overall larger dry mass and a slightly reduced cell sphericity. This illustrates how the cells may be classified into WP, CB and TA groups per the distribution of speed, area, dry mass, sphericity, ellipticity, and meandering index.

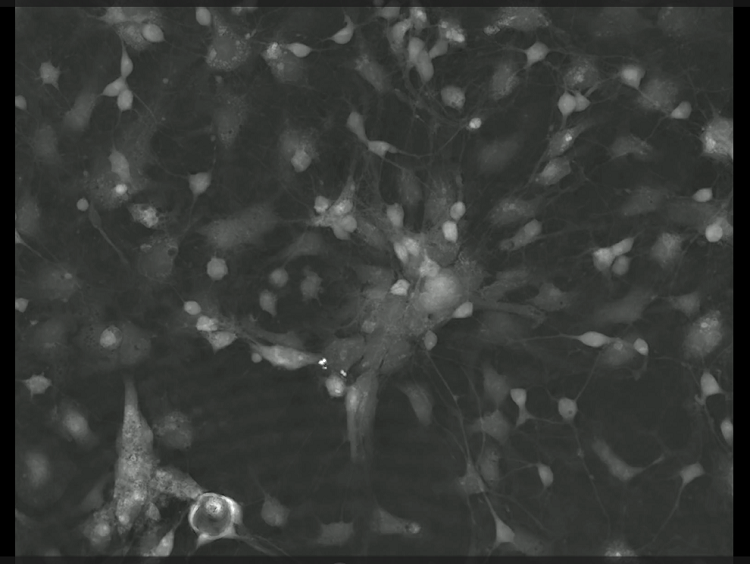
Single Neuronal Cell for Quantitative Analysis
Microglia displayed higher standard deviation of pixel intensity than astrocytes although their mean pixel intensity was similar. This likely reflects the differences in intracellular granularity between the cell types. Neurons displayed a significantly higher mean intensity than microglia or astrocytes.

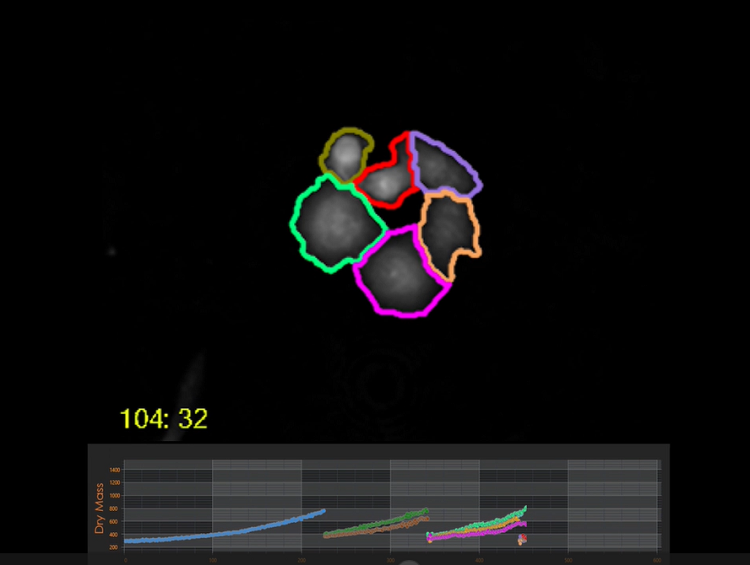
2、Single-cell Lineage
Automatically segment and track individuals and identify their division events and children. Quick and easy track correction enables perfect lineage determination. Explore single cell or whole lineage phenotypical properties across multiple generations.
Observe and examine cell behaviour over multiple generations
When a cell divides the two daughter cells retain the parental Cell ID on so forth
We can also generate Lineage Feature (csv appears). This data shows how long each generations lasts (Start & End Time) and which generation the cell is from.
Identify Specific Sub-populations

Identify Cell Fusion Events
Dry mass of Cell 1 is twice than Cell 2, probably a bi-nuclear cell.
Cell 1 has a longer cell cycle compared to Cell 1.
Cell 1 migrate further and at a higher velocity.

Single-cell Lineage:
3、Wound Healing
Livecyte uses high contrast images to automatically segment and track single cells in up to 96 well plate format. Combined with its large fields of view (up to 4mm²) this enables users to...
Overcome the limitations of confluence-based approaches by using a direct measure of cell motility.
Automatically calculate leading edge cell speed and directionality.
Definitively separate out migration from proliferative or morphological behaviours using Dashboards.
Livecyte can measure the migration of single cells in wound healing assays rather than overly simplistic confluence-based models.
It does this by automatically tracking individual cells and directly measuring their motility over time.
This allows determination of both speed and direction of motion, giving a richer description of how a wound closes.
Mouse over the image on the right to show the trails coloured by cell speed.

Wound Healing Video:
4、Adipocyte analysis
Maturing adipocytes were shown to have a great pixel intensity and greater number of lipid droplets present inside of cells .
The increase lipid droplet number over time was proportional to the total mass present in the images.
Livecyte provides a non-perturbing solution for long-term imaging of adipocytes and a potential orthogonal approach to Oil Red O staining for assessing adipocyte maturation through the quantification of total dry mas.

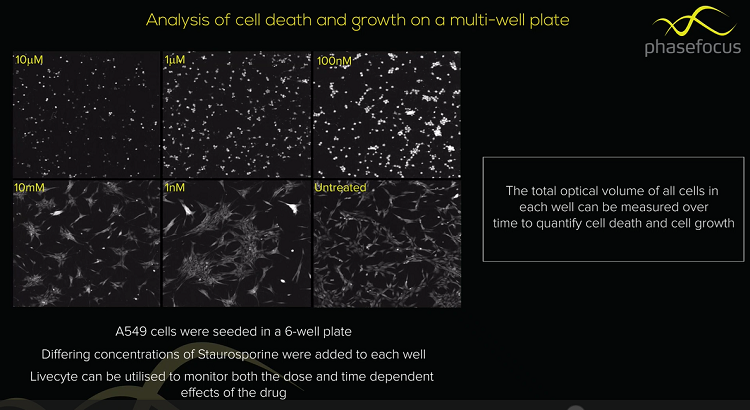
5、Cell Cytotoxicity Assay
Cytotoxicity assays are widely used in the pharmaceutical industry and are a fundamental tool in the drug discovery process. They quantify the effect of treatments on cell death through processes such as apoptosis (programmed cell death) and necrosis (uncontrolled cell death), amongst others.
Conventionally these are quantified through the application of fluorescence dyes and phototoxic illumination. However expression can vary from one death event to another, and they take no consideration of how many cells were initially present.
Livecyte is a multichannel assay-driven system that enables users to…
Automatically quantify fluorescence on a single-cell level in an assay relevant plate format (96 wells).
Quantify cell death events label-free.
Combine with proliferation and growth data for a comprehensive view of cell behaviour.

Cell Cytotoxicity Assay Video:
6、Angiogenesis
Label-free timelapse tube formation assays.
High-resolution large fields-of-view with no stitching.
Perform assays on Matrigel and standard plates.
Automated post-acquisition focus ensures consistent image quality for every well.
Simple, yet powerful analysis of tube formation metrics with Application Dashboard outputs.

Angiogenesis Video:
7、Spheroid
The quantitative changes of the circumference and area of tumor spheres under the action of drugs can be analyzed.

Spheroid Video:
8、T-cell Killing Assay
Our revolutionary new assay addresses the challenges you face in investigating the efficacy and cytotoxicity of engineered T-cells in killing target cancers. Livecyte uses advanced segmentation and tracking algorithms to segment effector T-cells and target cells automatically. In addition, Livecyte can accurately track target cells over time to quantify effector-target interactions from the start of the experiment building up a unique interaction profile until target cell death.
Livecyte automatically compiles metrics based on these killing interaction profiles into its Dashboard view, providing a wealth of information summarising T-cell cytotoxicity and target cell recognition, in addition to Livecyte’s standard phenotypic data. This enables Livecyte to specifically quantify effector-target cell interactions and behaviour independently from cytotoxicity, yielding greater depth of insight into how T-cells find and kill their targets.


T-cell Killing Video:
Video
Livecyte overview video
Cell lineage analysis video
Wound healing video
Nerve cell analysis video
Cell cytotoxicity assay video

Angiogenesis video

Spheroid video